
Ok, you are interested in how much you can make with this franchise, right?
So, I want you to a take a serious look at this Item 19, Financial Performance Representation, found in the 2013 Popeyes Louisiana Kitchen FDD.
First, the Item 19 is 14 pages long, with useful data collected from the franchise owner's profit and loss statements.
Here is one of the seven sales charts, detailing gross sales.
(Click on the image to see a full scale view.)
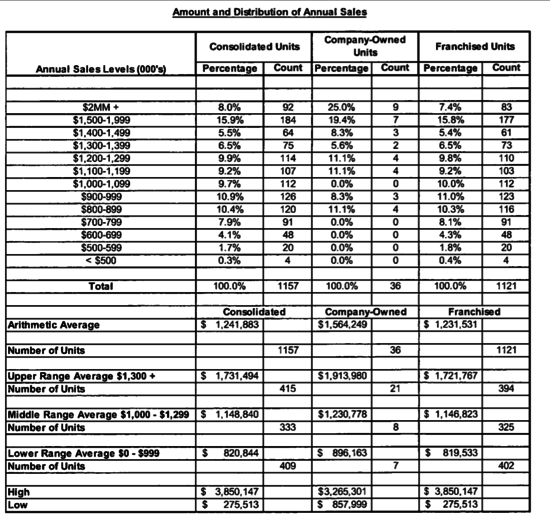
This is a good presentation. We don't have to guess about how many locations did how much volume.
We can read it off from the chart.
For example, we know that 24 stores had gross sales less than $600,000 and exactly 126 stores had gross sales between $900,000 and $1,000,000.
We aren't presented with meaningless AUV numbers, instead we are given data from which we can draw our own conclusions.
(There is a table at the bottom showing the high, middle, and low AUVs, but it is presented in the context of useful data. I am not against AUV, but there is no reason to present an AUV only without showing the data the average was calculated from.)
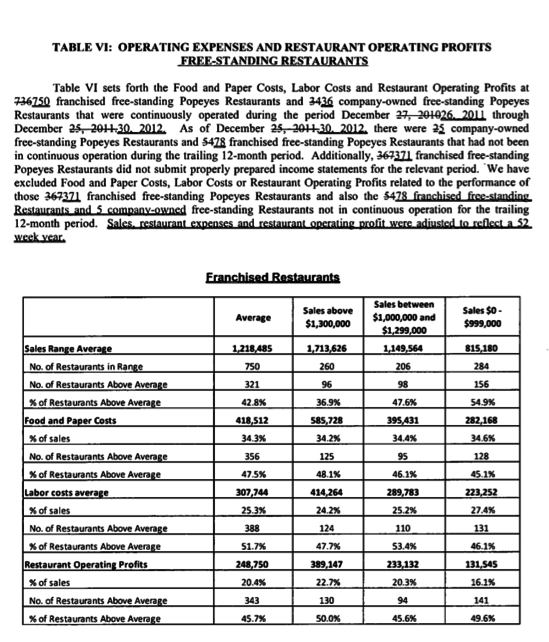
Second, there are seven charts - each an attempt to compare apples with apples.
The seven charts are for: all free standing restaurants, freestanding built in 2010, freestanding built in 2011, inline restaurants, convenience store restaurants, and other.
Again, this is very useful. It is especially helpful for Popeyes to have broken out the gross sales figures for stores built in 2010, and 2011. This will give you a better idea of what the first few years may hold in store for you.
Third, and this is most remarkable, Popeyes has constructed a composite P&L, profit and loss statement.
Click on the image to see the large image.
All in all, this is a useful Item 19 and will help the probable purchaser of a Popeyes Louisiana Kitchen franchise.
For the 5 Most Fascinating Stories in Franchising, a weekly report, click here & sign up.
